
Bond valuation tutorial
Contents
Bond valuation tutorial#
This is a tutorial describing the functions in the functions.py module. These functions are tailored to understanding the valuation of currently listed, investment grade Australian Government Treasury Bonds (eTBs).
Note. The payment periods for all eTBs are half-yearly. All figures are expressed, where relevant, in annulaused form.
Bond list#
The function etbList_AU() in module functions.py returns a pandas dataframe comprising the current list of exchange traded Australian Government Treasury Bonds (eTBs). These are obtained from the government website here.
from functions import etbList_AU

etblist = etbList_AU()
etblist = etblist.reset_index(drop=True)

etblist
| maturity | coupon | ASX_code | payDates | |
|---|---|---|---|---|
| 0 | 21-Apr-2023 | 5.50% | GSBG23 | 21-Apr, 21-Oct |
| 1 | 21-Apr-2024 | 2.75% | GSBG24 | 21-Apr, 21-Oct |
| 2 | 21-Nov-2024 | 0.25% | GSBU24 | 21-May, 21-Nov |
| 3 | 21-Apr-2025 | 3.25% | GSBG25 | 21-Apr, 21-Oct |
| 4 | 21-Nov-2025 | 0.25% | GSBU25 | 21-May, 21-Nov |
| 5 | 21-Apr-2026 | 4.25% | GSBG26 | 21-Apr, 21-Oct |
| 6 | 21-Sep-2026 | 0.50% | GSBQ26 | 21-Sep, 21-Mar |
| 7 | 21-Apr-2027 | 4.75% | GSBG27 | 21-Apr, 21-Oct |
| 8 | 21-Nov-2027 | 2.75% | GSBU27 | 21-Nov, 21-May |
| 9 | 21-May-2028 | 2.25% | GSBI28 | 21-May, 21-Nov |
| 10 | 21-Nov-2028 | 2.75% | GSBU28 | 21-Nov, 21-May |
| 11 | 21-Apr-2029 | 3.25% | GSBG29 | 21-Apr, 21-Oct |
| 12 | 21-Nov-2029 | 2.75% | GSBU29 | 21-Nov, 21-May |
| 13 | 21-May-2030 | 2.50% | GSBI30 | 21-May, 21-Nov |
| 14 | 21-Dec-2030 | 1.00% | GSBW30 | 21-Dec, 21-Jun |
| 15 | 21-Jun-2031 | 1.50% | GSBK31 | 21-Jun, 21-Dec |
| 16 | 21-Nov-2031 | 1.00% | GSBU31 | 21-Nov, 21-May |
| 17 | 21-May-2032 | 1.25% | GSBI32 | 21-May, 21-Nov |
| 18 | 21-Nov-2032 | 1.75% | GSBU32 | 21-May, 21-Nov |
| 19 | 21-Apr-2033 | 4.50% | GSBG33 | 21-Apr, 21-Oct |
| 20 | 21-Nov-2033 | 3.00% | GSBU33 | 21-Nov, 21-May |
| 21 | 21-May-2034 | 3.75% | GSBI34 | 21-May, 21-Nov |
| 22 | 21-Jun-2035 | 2.75% | GSBK35 | 21-Jun, 21-Dec |
| 23 | 21-Apr-2037 | 3.75% | GSBG37 | 21-Apr, 21-Oct |
| 24 | 21-Jun-2039 | 3.25% | GSBK39 | 21-Jun, 21-Dec |
| 25 | 21-May-2041 | 2.75% | GSBI41 | 21-May, 21-Nov |
| 26 | 21-Mar-2047 | 3.00% | GSBE47 | 21-Mar, 21-Sep |
| 27 | 21-Jun-2051 | 1.75% | GSBK51 | 21-Jun, 21-Dec |
At the time of writing there are 28 eTBs currently issued by the Australian Government.
Bond Value#
The function etbListWithValueYield_AU() returns the same dataframe with the following columns added:
bond_value;bond_value_yields;bond_yields;netReturnOn_AUD1000
Each entry depends on the bond’s current market price. The bond’s value and value yields and net return on AUD1000 assume the bond holder buys the bond at the current market price and holds it to maturity.
This function passes no arguments and uses Python’s web scraper package BeautifulSoup to retrieve the bond’s current market price from Yahoo Finance. If values in any entry is is nan, it means Yahoo Finance did not have a record of this bond.
from functions import etbListWithValueYield_AU

etblist_value_yield = etbListWithValueYield_AU()

etblist_value_yield = etblist_value_yield.reset_index(drop=True)
etblist_value_yield
| maturity | coupon | ASX_code | payDates | bond_value | bond_value_yield | bond_yields | netReturnOn_AUD1000 | |
|---|---|---|---|---|---|---|---|---|
| 0 | 21-Apr-2023 | 5.50% | GSBG23 | 21-Apr, 21-Oct | -1.910 | -1.87% | 5.4% | -17.190 |
| 1 | 21-Apr-2024 | 2.75% | GSBG24 | 21-Apr, 21-Oct | 1.275 | 1.27% | 2.75% | 11.475 |
| 2 | 21-Nov-2024 | 0.25% | GSBU24 | 21-May, 21-Nov | 5.650 | 5.97% | 0.26% | 56.500 |
| 3 | 21-Apr-2025 | 3.25% | GSBG25 | 21-Apr, 21-Oct | 2.550 | 2.53% | 3.23% | 22.950 |
| 4 | 21-Nov-2025 | 0.25% | GSBU25 | 21-May, 21-Nov | 8.375 | 9.1% | 0.27% | 83.750 |
| 5 | 21-Apr-2026 | 4.25% | GSBG26 | 21-Apr, 21-Oct | 2.955 | 2.86% | 4.11% | 26.595 |
| 6 | 21-Sep-2026 | 0.50% | GSBQ26 | 21-Sep, 21-Mar | 9.820 | 10.8% | 0.55% | 98.200 |
| 7 | 21-Apr-2027 | 4.75% | GSBG27 | 21-Apr, 21-Oct | 2.910 | 2.73% | 4.46% | 26.190 |
| 8 | 21-Nov-2027 | 2.75% | GSBU27 | 21-Nov, 21-May | 9.455 | 9.71% | 2.82% | 94.550 |
| 9 | 21-May-2028 | 2.25% | GSBI28 | 21-May, 21-Nov | 10.855 | 11.45% | 2.37% | 108.550 |
| 10 | 21-Nov-2028 | 2.75% | GSBU28 | 21-Nov, 21-May | 11.480 | 11.86% | 2.84% | 114.800 |
| 11 | 21-Apr-2029 | 3.25% | GSBG29 | 21-Apr, 21-Oct | 10.300 | 10.36% | 3.27% | 103.000 |
| 12 | 21-Nov-2029 | 2.75% | GSBU29 | 21-Nov, 21-May | 14.275 | 14.97% | 2.88% | 142.750 |
| 13 | 21-May-2030 | 2.50% | GSBI30 | 21-May, 21-Nov | 16.830 | 18.31% | 2.72% | 168.300 |
| 14 | 21-Dec-2030 | 1.00% | GSBW30 | 21-Dec, 21-Jun | 22.250 | 27.22% | 1.22% | 267.000 |
| 15 | 21-Jun-2031 | 1.50% | GSBK31 | 21-Jun, 21-Dec | 19.610 | 22.7% | 1.74% | 215.710 |
| 16 | 21-Nov-2031 | 1.00% | GSBU31 | 21-Nov, 21-May | 24.690 | 30.94% | 1.25% | 296.280 |
| 17 | 21-May-2032 | 1.25% | GSBI32 | 21-May, 21-Nov | 24.385 | 30.02% | 1.54% | 292.620 |
| 18 | 21-Nov-2032 | 1.75% | GSBU32 | 21-May, 21-Nov | 24.330 | 28.82% | 2.07% | 267.630 |
| 19 | 21-Apr-2033 | 4.50% | GSBG33 | 21-Apr, 21-Oct | 16.100 | 15.13% | 4.23% | 144.900 |
| 20 | 21-Nov-2033 | 3.00% | GSBU33 | 21-Nov, 21-May | 22.140 | 23.46% | 3.18% | 221.400 |
| 21 | 21-May-2034 | 3.75% | GSBI34 | 21-May, 21-Nov | 22.855 | 23.38% | 3.84% | 228.550 |
| 22 | 21-Jun-2035 | 2.75% | GSBK35 | 21-Jun, 21-Dec | 26.830 | 29.92% | 3.07% | 295.130 |
| 23 | 21-Apr-2037 | 3.75% | GSBG37 | 21-Apr, 21-Oct | 26.990 | 27.19% | 3.78% | 269.900 |
| 24 | 21-Jun-2039 | 3.25% | GSBK39 | 21-Jun, 21-Dec | 35.320 | 38.95% | 3.58% | 388.520 |
| 25 | 21-May-2041 | 2.75% | GSBI41 | 21-May, 21-Nov | 41.840 | 50.46% | 3.32% | 502.080 |
| 26 | 21-Mar-2047 | 3.00% | GSBE47 | 21-Mar, 21-Sep | 51.360 | 60.68% | 3.54% | 564.960 |
| 27 | 21-Jun-2051 | 1.75% | GSBK51 | 21-Jun, 21-Dec | 62.460 | 100.68% | 2.82% | 999.360 |
Note. If a value in the bond_value column is negative, it means the corresponding bond is overpriced in the market. One expects to lose money if one buys at the current market price and holdis it to maturity. This can also be seen in the column netReturnOn_AUD1000.
Note. The bond value yield is a means of comparing bonds with differing maturities. It is used in calculating stock RROI.
At time of writing the value of the longest maturity bond on the list, GSBK51 is 62.46. This means if we buy 100 units of GSBK51at the current market price, we will earn 62.46 * 100 = 6246 at maturity, being 21-Jun-2051. Alternatively, if we invest AUD1000, this allows us to buy AUD1000 // current_market_price many units. At time of writing, we see that net return will be 999.360. So, by 21-Jun-2051, the value of our investment in GSBK51 will have (almost) doubled.
Lastly, while the coupon on this bond is 1.75% per year, it is trading at below face value. Its yield is therefore higher. We see it is 2.82%.
Bond list with Run Rate#
A crucial component in the valuations above is the assumption the bond holder holds to maturity. Bonds which are closer to maturity ought to have lower value since their market price will tend to converge to face value at maturity. A better means of comparing bonds with differing maturities is then to simply correct for maturity, yielding a bond’s “run-rate”. That is, dividing their value by their time to maturity. A bond’s run rate is equivalently its net value per unit time, which we have annualised to net value per year.
Note. *While the value yield in the bond_value_yield column is another means of comparing bonds, we propose it is not as intuitive a measure as the run rate.
The function etbListWithValueYieldRunRate() in functions.py returns the same data as etbListWithValueYield_AU() with an extra column recording the bond’s run rate. It does not pass any arguments.
from functions import etbListWithValueYieldRunRate_AU

etblistvalue_yield_runrate = etbListWithValueYieldRunRate_AU()

etblistvalue_yield_runrate = etblistvalue_yield_runrate.reset_index(drop=True)
etblistvalue_yield_runrate[['ASX_code', 'runRate_annualised']] # displaying only the bond code and run rate
| ASX_code | runRate_annualised | |
|---|---|---|
| 0 | GSBG23 | 0.000000 |
| 1 | GSBG24 | 2.550000 |
| 2 | GSBU24 | 5.650000 |
| 3 | GSBG25 | 2.550000 |
| 4 | GSBU25 | 5.583333 |
| 5 | GSBG26 | 1.970000 |
| 6 | GSBQ26 | 6.546667 |
| 7 | GSBG27 | 1.455000 |
| 8 | GSBU27 | 3.782000 |
| 9 | GSBI28 | 4.342000 |
| 10 | GSBU28 | 3.826667 |
| 11 | GSBG29 | 3.433333 |
| 12 | GSBU29 | 4.078571 |
| 13 | GSBI30 | 4.808571 |
| 14 | GSBW30 | 5.562500 |
| 15 | GSBK31 | 4.902500 |
| 16 | GSBU31 | 5.486667 |
| 17 | GSBI32 | 5.418889 |
| 18 | GSBU32 | 4.866000 |
| 19 | GSBG33 | 3.220000 |
| 20 | GSBU33 | 4.025455 |
| 21 | GSBI34 | 4.155455 |
| 22 | GSBK35 | 4.471667 |
| 23 | GSBG37 | 3.855714 |
| 24 | GSBK39 | 4.415000 |
| 25 | GSBI41 | 4.648889 |
| 26 | GSBE47 | 4.280000 |
| 27 | GSBK51 | 4.461429 |
Since the above is a pandas dataframe we can call the method sort_values() to reorder by run_rate. The highest value-per-unit-time bond is at the top; while the lowest is at the bottom.
etblistvalue_yield_runrate.sort_values('runRate_annualised', ascending=False).reset_index(drop=True)
| maturity | coupon | ASX_code | payDates | bond_value | bond_value_yield | bond_yields | netReturnOn_AUD1000 | runRate_annualised | |
|---|---|---|---|---|---|---|---|---|---|
| 0 | 21-Sep-2026 | 0.50% | GSBQ26 | 21-Sep, 21-Mar | 9.820 | 10.8% | 0.55% | 98.200 | 6.546667 |
| 1 | 21-Nov-2024 | 0.25% | GSBU24 | 21-May, 21-Nov | 5.650 | 5.97% | 0.26% | 56.500 | 5.650000 |
| 2 | 21-Nov-2025 | 0.25% | GSBU25 | 21-May, 21-Nov | 8.375 | 9.1% | 0.27% | 83.750 | 5.583333 |
| 3 | 21-Dec-2030 | 1.00% | GSBW30 | 21-Dec, 21-Jun | 22.250 | 27.22% | 1.22% | 267.000 | 5.562500 |
| 4 | 21-Nov-2031 | 1.00% | GSBU31 | 21-Nov, 21-May | 24.690 | 30.94% | 1.25% | 296.280 | 5.486667 |
| 5 | 21-May-2032 | 1.25% | GSBI32 | 21-May, 21-Nov | 24.385 | 30.02% | 1.54% | 292.620 | 5.418889 |
| 6 | 21-Jun-2031 | 1.50% | GSBK31 | 21-Jun, 21-Dec | 19.610 | 22.7% | 1.74% | 215.710 | 4.902500 |
| 7 | 21-Nov-2032 | 1.75% | GSBU32 | 21-May, 21-Nov | 24.330 | 28.82% | 2.07% | 267.630 | 4.866000 |
| 8 | 21-May-2030 | 2.50% | GSBI30 | 21-May, 21-Nov | 16.830 | 18.31% | 2.72% | 168.300 | 4.808571 |
| 9 | 21-May-2041 | 2.75% | GSBI41 | 21-May, 21-Nov | 41.840 | 50.46% | 3.32% | 502.080 | 4.648889 |
| 10 | 21-Jun-2035 | 2.75% | GSBK35 | 21-Jun, 21-Dec | 26.830 | 29.92% | 3.07% | 295.130 | 4.471667 |
| 11 | 21-Jun-2051 | 1.75% | GSBK51 | 21-Jun, 21-Dec | 62.460 | 100.68% | 2.82% | 999.360 | 4.461429 |
| 12 | 21-Jun-2039 | 3.25% | GSBK39 | 21-Jun, 21-Dec | 35.320 | 38.95% | 3.58% | 388.520 | 4.415000 |
| 13 | 21-May-2028 | 2.25% | GSBI28 | 21-May, 21-Nov | 10.855 | 11.45% | 2.37% | 108.550 | 4.342000 |
| 14 | 21-Mar-2047 | 3.00% | GSBE47 | 21-Mar, 21-Sep | 51.360 | 60.68% | 3.54% | 564.960 | 4.280000 |
| 15 | 21-May-2034 | 3.75% | GSBI34 | 21-May, 21-Nov | 22.855 | 23.38% | 3.84% | 228.550 | 4.155455 |
| 16 | 21-Nov-2029 | 2.75% | GSBU29 | 21-Nov, 21-May | 14.275 | 14.97% | 2.88% | 142.750 | 4.078571 |
| 17 | 21-Nov-2033 | 3.00% | GSBU33 | 21-Nov, 21-May | 22.140 | 23.46% | 3.18% | 221.400 | 4.025455 |
| 18 | 21-Apr-2037 | 3.75% | GSBG37 | 21-Apr, 21-Oct | 26.990 | 27.19% | 3.78% | 269.900 | 3.855714 |
| 19 | 21-Nov-2028 | 2.75% | GSBU28 | 21-Nov, 21-May | 11.480 | 11.86% | 2.84% | 114.800 | 3.826667 |
| 20 | 21-Nov-2027 | 2.75% | GSBU27 | 21-Nov, 21-May | 9.455 | 9.71% | 2.82% | 94.550 | 3.782000 |
| 21 | 21-Apr-2029 | 3.25% | GSBG29 | 21-Apr, 21-Oct | 10.300 | 10.36% | 3.27% | 103.000 | 3.433333 |
| 22 | 21-Apr-2033 | 4.50% | GSBG33 | 21-Apr, 21-Oct | 16.100 | 15.13% | 4.23% | 144.900 | 3.220000 |
| 23 | 21-Apr-2024 | 2.75% | GSBG24 | 21-Apr, 21-Oct | 1.275 | 1.27% | 2.75% | 11.475 | 2.550000 |
| 24 | 21-Apr-2025 | 3.25% | GSBG25 | 21-Apr, 21-Oct | 2.550 | 2.53% | 3.23% | 22.950 | 2.550000 |
| 25 | 21-Apr-2026 | 4.25% | GSBG26 | 21-Apr, 21-Oct | 2.955 | 2.86% | 4.11% | 26.595 | 1.970000 |
| 26 | 21-Apr-2027 | 4.75% | GSBG27 | 21-Apr, 21-Oct | 2.910 | 2.73% | 4.46% | 26.190 | 1.455000 |
| 27 | 21-Apr-2023 | 5.50% | GSBG23 | 21-Apr, 21-Oct | -1.910 | -1.87% | 5.4% | -17.190 | 0.000000 |
At time of writing it is interesting to note, while the coupon and yield of bonds GSBU24 and GSBQ26 are quite low compared to others, they nevertheless have high run rates. This is due to these bonds currently trading at market price below face value in addition to having a relatively soons maturities.
And so, while its yields are low, the above result suggests GSBU24 and GSBQ26 are good buys when its market price, face value and maturity are considered.
Yield curve#
In the module yield_sketch.py the function sketch_yields() uses the Python plotting package matplotlib to display the yield curve graph. It is a sketch of bond yields against bonds. Superimposed on the graph is the regression line, which is sketched using the Python package scipy. The yield curve is said to be inverted if the slope of the regression line is negative, meaning yields of longer term maturity bonds are, on average, lower than the shorter term maturities.
Inverted yields are indicative of upcoming recessions, apparently.
The function sketch_yields() does not pass any arguments.
from yield_sketch import sketch_yields

sketch_yields()
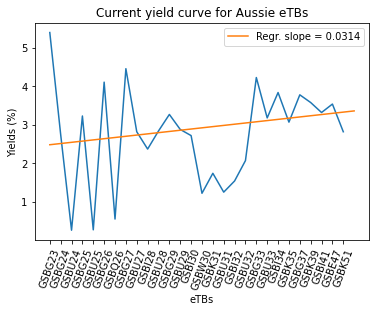
At time of writing, the current yield curve regression slope is 0.0314. This is positive, meaning the yield curve is not inverted.